Search
Bookmarks
My requests
Create/Join exam
Test Series
Mock tests
?
Sign In
Click to login or register
Toggle Sidebar
SB_2016
HSC - English 1st Paper
→
3. Writing Part
→
Report
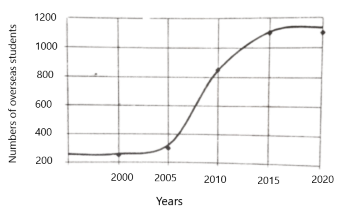
The graph below shows an increase in the number of overseas students at the universities which usually takes place over a period of time. Describe the graph in 150 words:
Guide Answer
Add Answer
?
Loading answers...
Home
Search
Exam
Mock
Saved