Search
Bookmarks
My requests
Create/Join exam
Test Series
Mock tests
?
Sign In
Click to login or register
Toggle Sidebar
ChB_2018
BB_2018
RB_2018
CB_2018
HSC - English 1st Paper
→
3. Writing Part
→
Report
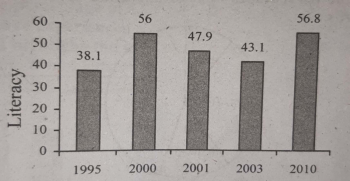
The graph below shows the literacy rate of Bangladesh from 1995 to 2010.Describe the graph in at least 80 words. You should highlight the information and report the main features given in the graph.
Guide Answer
Add Answer
?
Loading answers...
Home
Search
Exam
Mock
Saved