Search
Bookmarks
My requests
Create/Join exam
Test Series
Mock tests
?
Sign In
Click to login or register
Toggle Sidebar
DiB_2019
HSC - English 1st Paper
→
3. Writing Part
→
Report
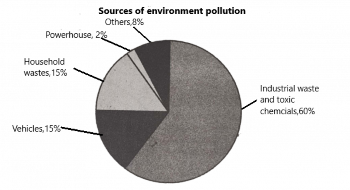
Look at the chart below. It shows the sources of environment pollution in a city. Now, analyse the chart in at least 80 words. You should highlight the information and the main features given in the chart:
Guide Answer
Add Answer
?
Loading answers...
Home
Search
Exam
Mock
Saved