JB_2018DB_2018DiB_2018SB_2018
The graph below shows 'the number of people living below the poverty line' from 1995 to 2010.Describe the graph in at least 80 words. You should highlight the information and report the main features given in the graph.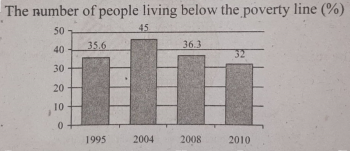
Loading answers...