CB_2019RB_2017
The graph below shows 'The Internet Users' from 2000 to 2009. The number is mentioned in lakh. Describe the graph in at least 80 words. You should highlight the information and report the main features given in the graph.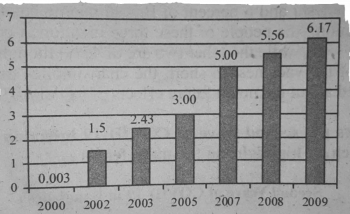
Loading answers...